
With more than one location the question is always which one is busy and which one is carrying the other. This report puts them side by side on the same measures.
What it shows
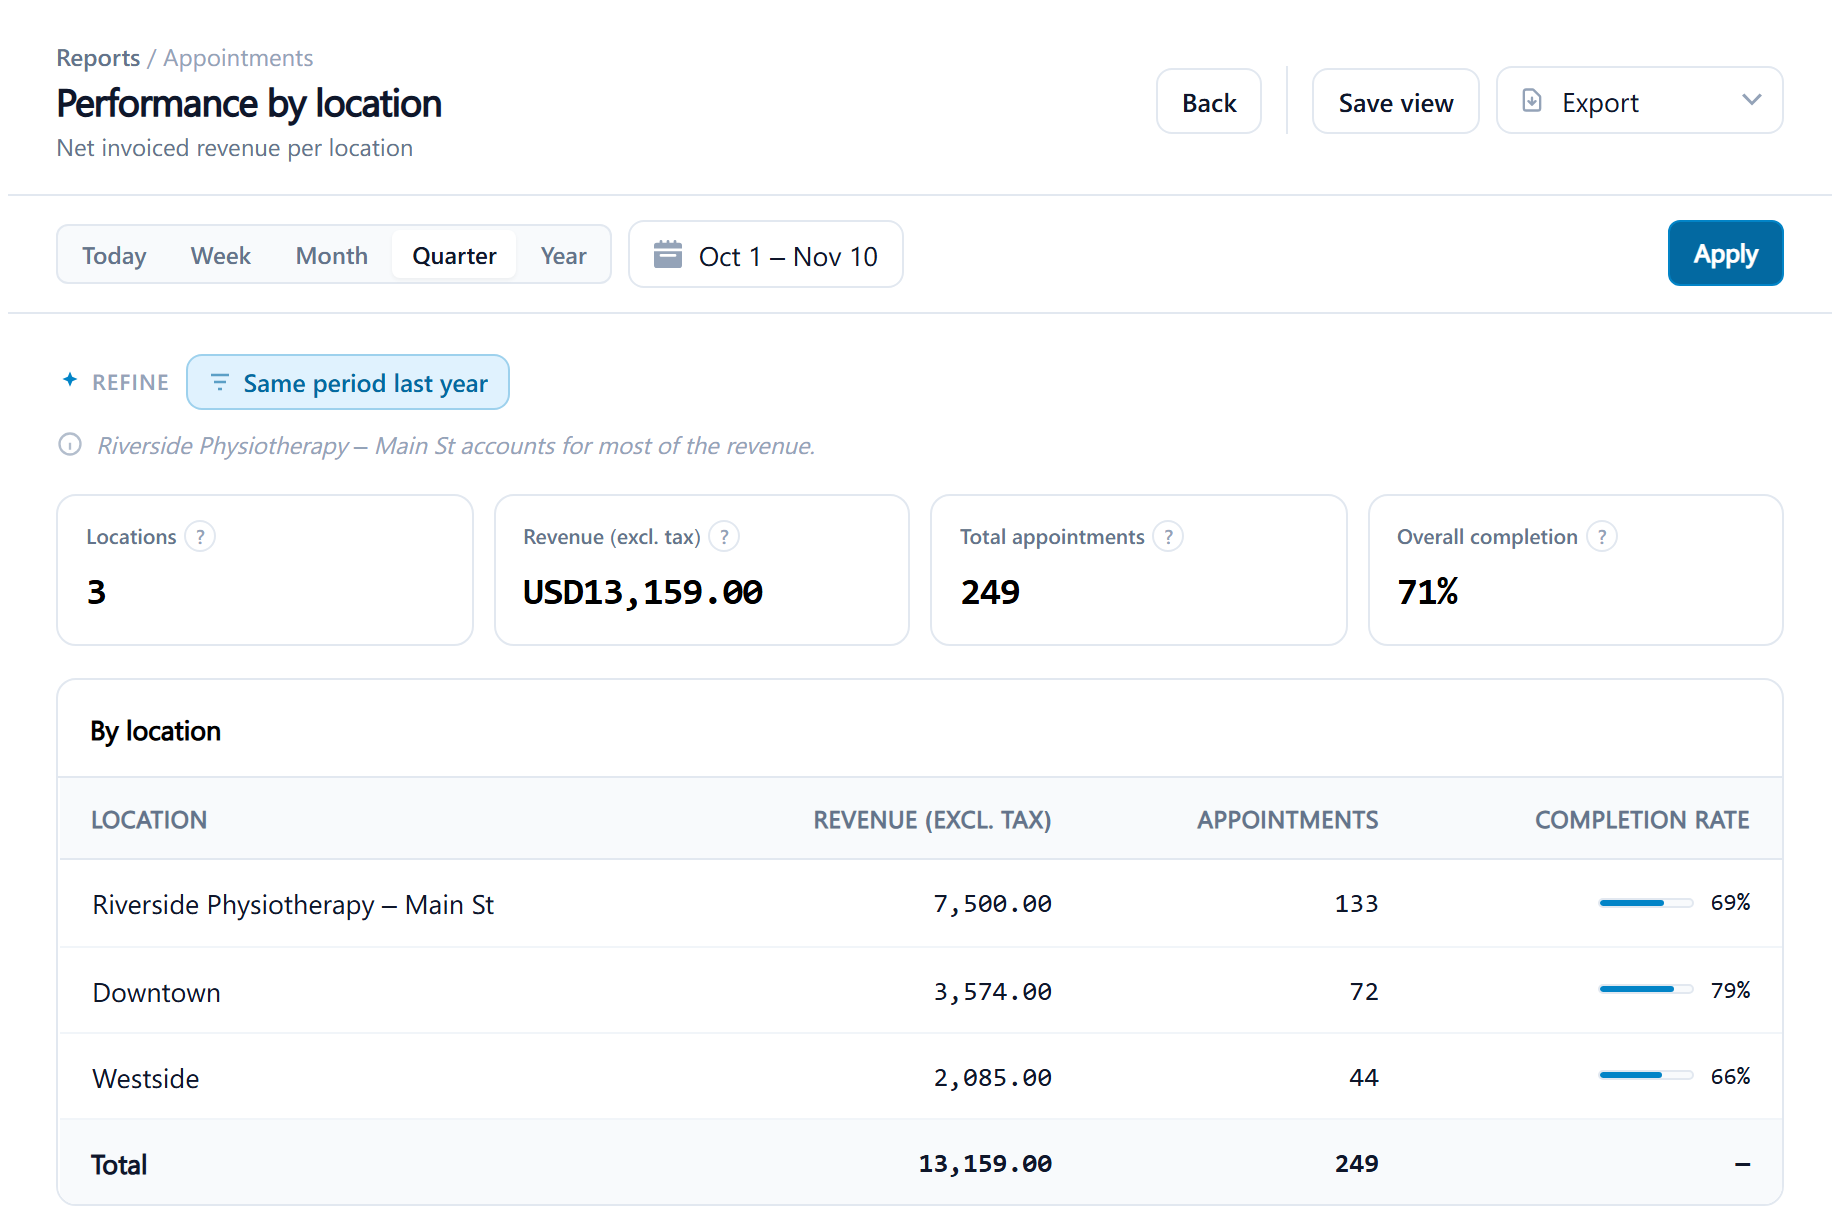
Performance by location compares every location you can see over the period: net invoiced revenue excluding tax, total appointments and the share completed. A user limited to one location sees that one row.
Filters: a date range with the presets Today, Week, Month, Quarter and Year or a custom range. It needs the operational reports permission, which every role has.
Reading it
Headline figures: Locations, Revenue (excl. tax), Total appointments, Overall completion.
Columns: Location, Revenue (excl. tax), Appointments, Completion rate.
Acting on it
It's the quick way to see which site needs attention; the other reports filtered to that location give the detail. Completion rate below the others points at cancellations and no-shows there.